

AI in Retail & E-commerce: What Works Below Amazon Scale
Most retail AI advice is about firms with a hundred million customers and a thousand engineers. Very little of it fits a chain of twelve stores. Even less fits a D2C brand doing four hundred orders a day. This is what works at that size, and what does not.
17 min read
First
What You Have Been Told, and What Is Actually True
Most retail AI talk borrows its ideas from case studies about firms nothing like yours. Clear those out first.
| The claim | What is actually true at your scale |
|---|---|
| Recommendations lift revenue 30% | That figure comes from marketplaces with millions of SKUs. On a 400-SKU catalogue, a shopper can already see the whole range. The gain is real but small. It comes from better ordering, not from discovery. |
| You need a data lake first | You do not. Each use case here runs on your order table, product master and web analytics. Build the data platform later if you want one. It is not a reason to delay the first project. |
| Dynamic pricing means changing prices constantly | It means changing them on purpose, within guard rails you set. It applies to the small set of SKUs where demand really moves with price. Most of your catalogue should not move at all. |
| AI will personalise everything | Personalisation needs enough behaviour per customer to learn from. Most of your buyers have bought once. There is nothing there to personalise on, and segment-level targeting will beat it. |
| Chatbots deflect most support tickets | They deflect the repetitive third: order status, returns rules, size guidance. The rest still needs a person. Pretend otherwise and you earn a one-star review about never reaching a human. |
A mid-sized retailer has one real advantage: the whole picture fits in one place. Your order history, product master, web analytics and returns log are four tables. Not four hundred systems. Joining them takes about a week, not a platform migration. Once joined, they answer questions that change what you stock and what you promote.
The problem is volume. Many retail methods need either a lot of customers or a lot of repeat buying. If you have neither, no model invents it for you. The eight below are marked for that. Some work from your first thousand orders. Some need a year of repeat buying before they tell you anything new.

Demand Forecasting
Stop ordering against last year plus a feeling.
Most retailers forecast by taking last season and adding some optimism. That works for staples. It fails everywhere else. This is why you hold dead stock and run out of the things people want at the same time. Both are one error, measured in two directions.
A forecast pulls apart what is really driving sales. Trend and seasonality. The lift from the discount you ran. The SKU that always moves before a festival. It then gives you a range rather than a single number. The range is the useful part. If a SKU will sell between 80 and 140 units, your buyer knows how much cover to hold. A flat 110 tells them nothing about risk.
Works from
- One full seasonal cycle of order history, two is better
- Your promotion calendar, so discounts are not read as demand
- Stock-out dates: a SKU no one could buy is not a SKU no one wanted
- SKU-level data, not category totals

Fraud Detection & Prevention
COD abuse, return fraud and payment testing, caught by behaviour rather than by rules.
Indian e-commerce has a fraud pattern most Western material ignores. Three things stand out: cash-on-delivery refusal, serial returners, and small address changes used to beat blocklists. Rules catch the obvious cases. They are also easy to get around. Anyone blocked once knows to change one character in the address.
Behavioural models score each order against patterns instead of rules. How the session behaved. Whether the address looks like earlier refusals. Whether the basket matches a known return pattern. The output is a score with reasons attached. You choose the action: hold it for confirmation, ask for prepayment, or let it through.
This is often the fastest case to prove in Indian retail. COD refusal has a direct cost you can count. It already sits in your courier bills, in forward and reverse logistics.
Measure
- COD refusal rate before and after, by cohort
- False positives: real buyers blocked, which cost more than the fraud
- Return rate by customer, not just overall
- Reverse logistics spend, where the saving shows up

Product Recommendation
Useful for ordering what people already see, rather than for discovery.
On a few hundred SKUs, recommendation is not solving discovery. A shopper can browse the whole range anyway. What it does is sort that range, so the most relevant items come first. It also puts real complements next to the item at checkout.
The technique matters less than the data. With enough repeat buyers, behavioural recommendation works well. Most Indian D2C brands do not have them. There, recommendation built on product attributes wins. It can reason about a shopper with no history at all.
Choose by your data
- Mostly repeat customers → behavioural recommendation works
- Mostly first-time buyers → attribute-based will beat it
- Cold-start is the normal case in Indian D2C, not the edge case
- Measure against a simple bestseller baseline, or you cannot claim a lift

Abandoned Cart Prediction
Which carts are worth chasing, and which discount you would give away for nothing.
Most cart recovery sends the same reminder and the same discount to everyone. Some of those buyers were coming back anyway. That discount is margin you gave away for nothing. Worse, it teaches regular buyers to abandon on purpose.
Prediction splits the cart that will convert on its own from the one you have really lost. It then weighs which nudge is worth its cost. Some carts need nothing. Some need a reminder. Only a few are worth a discount, and knowing which ones is the whole point.
Watch for
- Buyers who learn to abandon because a discount always follows
- Measuring recovery rate without measuring margin given away
- Checkout friction that looks like abandonment: fix the form first
- Needs session-level analytics, not just order data
Price Optimisation
Change prices deliberately on the SKUs where it matters, within limits you set.
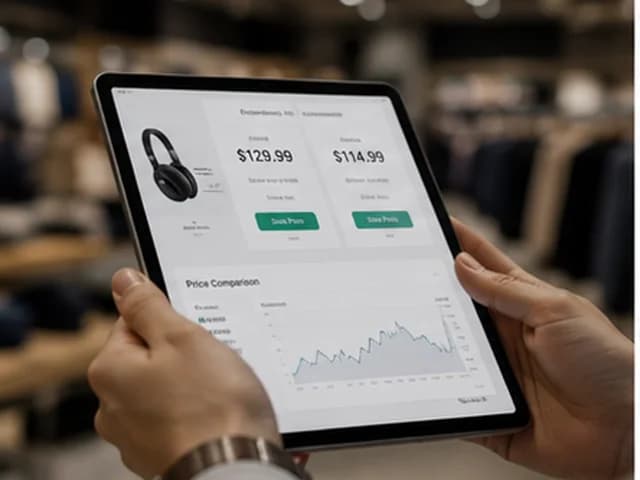
Price sensitivity varies a lot across a catalogue. Some SKUs get compared on three sites before the sale. Others go into the basket without a glance at the price. Treat them alike and you leave margin on one group and lose volume on the other.
A model works out elasticity per SKU from your own sales history. It then suggests moves within guard rails you set. Never below cost plus margin. Never more than a set amount in one week. Never on the lines you have marked as price anchors. The guard rails matter as much as the model. An optimiser with no limits will find that cutting all prices lifts volume, which is true and also ruinous.
Guard rails first
- Floor price per SKU, set by you and never crossed
- Maximum movement per period, so prices do not swing
- Anchor SKUs left out, the ones buyers judge your prices by
- Needs real price variation in your history, or there is nothing to learn from
Market Basket Analysis
What actually sells together, rather than what everyone assumes sells together.
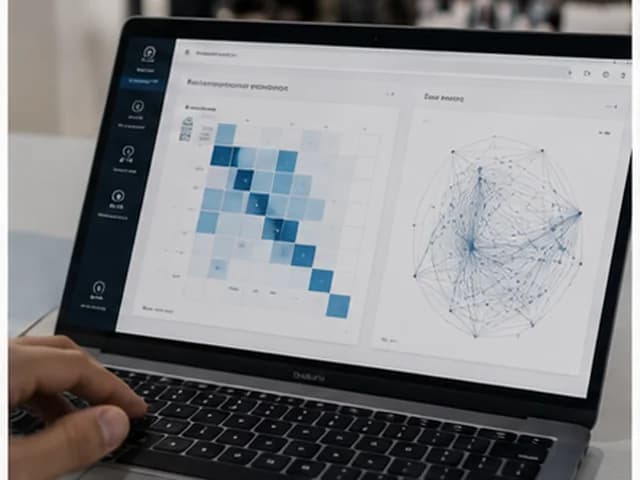
Each category manager has a theory about which products sell together. Some of those theories are right. Basket analysis tests them against what buyers actually did. The surprises are where the value sits: the pairing no one expected, which then drives bundling, placement and cross-sell.
It is the least glamorous method here and one of the most useful. It needs no customer identity at all. Anonymous baskets are enough. That means it works from day one, on a business with no login and no repeat purchase data.
Why it is a good early project
- Needs only transaction lines, no customer identity, no login
- Works on one-time buyers, unlike most personalisation
- Output goes straight into merchandising decisions people already make
- Watch for coincidence: two items selling in December are seasonal, not linked

Sentiment Analysis
Read every review and ticket, and find out what buyers really complain about.
Reviews and support tickets hold the most direct information you have about product problems. Almost no one reads them in an organised way. What gets read is the extremes: the furious one-star and the delighted five-star. Those two are the least representative reviews you have.
Sort them all by product, theme and severity, and the recurring problems show up. The useful output is rarely an overall sentiment score. It is that eleven buyers in six weeks named the same sizing problem on one SKU. That is a merchandising fix no one would have found by reading.
Make it actionable
- Classify by theme and SKU, not just positive or negative
- Include support tickets and WhatsApp messages, not only public reviews
- Handle Hinglish and transliterated text: most Indian review data is not clean English
- Route findings to whoever can act: merchandising, not marketing

Store Performance Analytics
Compare stores fairly, and separate what the manager controls from what the catchment gave them.
Store rankings by revenue mostly measure catchment. A store in a busy market beats one in a quiet lane, however well that second store is run. Ranking them together tells you nothing about management. It also demoralises the people running the hard stores well.
Model the performance you should expect from catchment, footfall, format and assortment. Then you can compare each store against its own expectation. That finds the weak store in a good location. It also finds the store doing fine work in a hard one, and those are the practices worth copying.
Needs
- Store-level sales by category and by day
- Location attributes: catchment, format, size, competition nearby
- Footfall where you have it, or the model has to infer
- Staffing and manager tenure, to separate the manager from the site
Where We Specialise
Agents That Handle the Volume
Retail runs on small decisions taken hundreds of times a day. Answer this query, move that stock, write this listing, approve that return. Each one is easy, and none is hard to explain. The problem is volume, and that is what an agent is for.
The four below run within rules you set, and escalate anything unusual. None of them sets policy. They apply the policy you already have, at a scale your team cannot.
Customer Resolution Agent
Order status, returns and sizing answered from your own systems, and the rest escalated properly.
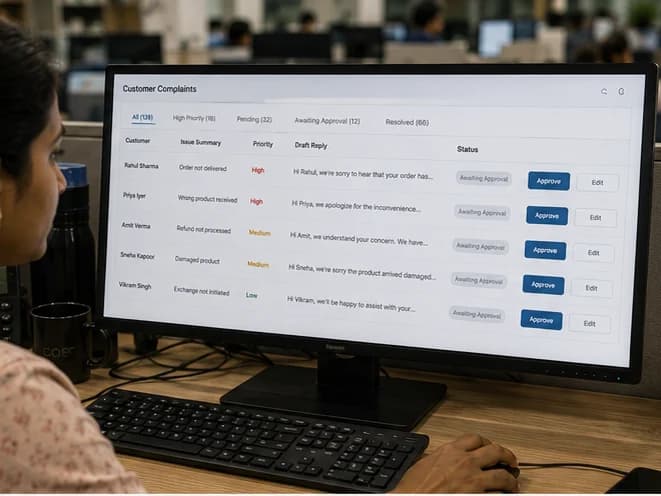
Most retail support volume is a small set of questions asked over and over. Where is my order, can I return this, will this size fit. Each needs a lookup and a line of policy. None needs judgement. They all land at once during a sale.
The agent answers from live order data and your real returns policy, not from a script. It drafts the reply. It then sends it under rules you set, or queues it for approval. What it escalates is properly escalated. The order history, the earlier conversation and the relevant policy come attached. The person starts informed rather than starting again.
The discipline that matters is escalating early. An agent that argues with an angry buyer for four turns has done more harm than answering nothing.
Rules to set first
- Where it may act alone and where it must queue for approval
- Refund and replacement limits it can authorise without a person
- Escalate on the first sign of anger, not after a few tries
- Languages it handles, including Hinglish, and what it does outside them
Replenishment Agent
Stock moved between locations before a stock-out, not after the weekly report.
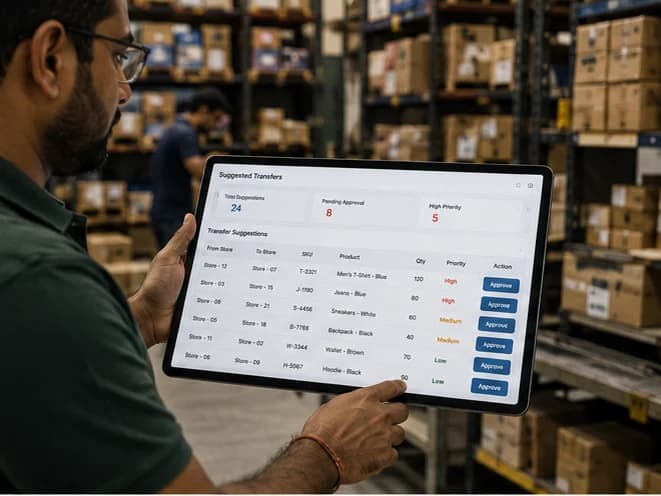
Across a few stores and a warehouse, stock is nearly always in the wrong place. One store is about to run out of a size another has held for six weeks. Both facts sit in the system. Neither is visible to anyone. Seeing them means running a report no one has time to run.
The agent watches stock against forecast demand at each store. It proposes transfers before a stock-out, not after: this size, from that store, in this quantity, arriving in time. It also drafts purchase orders when a SKU crosses its reorder point. And it chases the supplier confirmations that never came back.
Approval limits are yours. Below a value it can act on its own. Above it, a person confirms.
Depends on
- Accurate stock-on-hand: this amplifies bad inventory data rather than fixing it
- A demand forecast you trust at location level
- Realistic transfer lead times between locations
- Someone with the authority to approve, or proposals queue forever
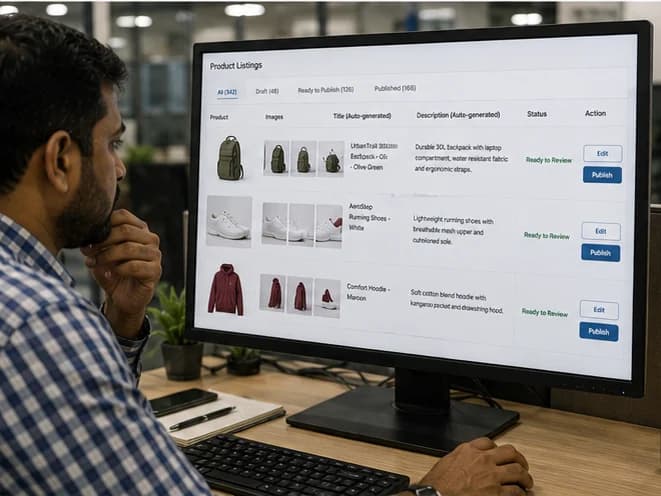
Listing & Content Agent
Catalogue copy drafted and kept consistent across each channel you sell on.
Each marketplace wants its own title format, attribute set and image ratio. Sell on your own site plus two marketplaces and you keep three versions of each product. They drift apart the moment anyone edits one.
The agent writes titles, descriptions and attributes to fit each channel, from your product master. It flags listings with required fields missing. It spots where the same SKU has drifted apart across channels. New products get draft copy the day they are added, not the week someone gets to them.
A person approves before anything goes live. What the agent removes is the typing and the reconciling, not the editorial judgement.
Most valuable when
- You sell on three or more channels with their own rules
- New SKUs arrive faster than copy can be written
- Listings have drifted apart and no one knows which is correct
- Keep a human approval step: marketplace penalties for bad copy are real
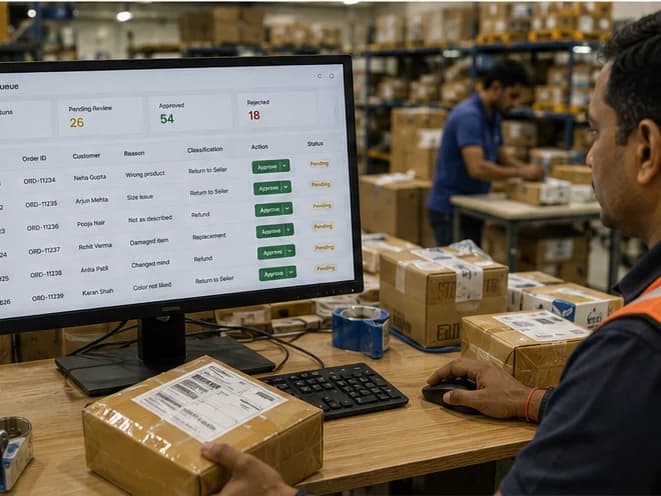
Returns Triage Agent
Every return classified, routed and dealt with on arrival, instead of piling up.
Returns arrive faster than they are processed, and the backlog costs you twice. Working capital sits in stock that is neither sellable nor written off. Buyers wait on refunds you promised them.
The agent reads the stated reason, the buyer's record and the product. Then it picks one of four routes: restock, refurbish, write off, or investigate. It triggers the refund where your policy allows. It also flags patterns. This SKU keeps coming back for the same reason. This buyer's return rate is an outlier.
That pattern flagging is often worth more than the processing. A SKU with a sizing fault shows up here weeks before it shows up in reviews.
Watch
- Return reasons by SKU: the fastest signal of a product fault you have
- Return rate outliers, handled by policy rather than by suspicion
- Refund turnaround, which drives review scores more than most retailers expect
- Fraud escalation must be a human decision, always
Before Any Of It
Fix These First
Each of these will quietly wreck a model. Each is cheaper to fix than to model around.
Stock-outs recorded as zero sales
Your data has to tell 'nobody wanted it' apart from 'we had none'. If it cannot, each forecast will under-order the SKUs that sell best. This one issue ruins more retail forecasting projects than any modelling choice.
A product master with inconsistent attributes
Sizes recorded as 'L', 'Large' and 'l'. Colours as free text. Attribute-based recommendation and listing automation both need this clean. Cleaning it takes a week, and that week pays for itself many times over.
Returns without structured reasons
Free-text return reasons can be classified. A structured reason captured at the point of return is far more reliable, and it costs you one dropdown.
No record of promotions
A model has to know that a spike was a discount, not demand. Without that record, it forecasts the spike again next year and you over-order.
Being Straight About It
Worth doing if
- Retailers with at least a year of order history at SKU level
- Multi-store or multi-channel operations where stock is often in the wrong place
- Businesses where COD refusal and returns are a known, countable cost
- Teams with someone who owns merchandising decisions and will act on findings
Probably not, if
- New businesses with less than a season of history: trade first, model later
- Catalogues under about fifty SKUs, where a category manager already knows every line
- Anyone wanting personalisation when most buyers have bought exactly once
- Operations whose stock data is known to be wrong: fix the count before modelling it
FAQ
Questions Retailers Ask Us
It depends on the use case. A vendor who gives you one number is guessing. Basket analysis works from a few thousand transactions. Forecasting needs at least one full seasonal cycle, and two is much better. One year cannot tell a trend from a season. Personalisation needs repeat buyers, not orders. Ten thousand orders from ten thousand people supports very little. Tell us your order count and your repeat rate, and we can be specific.
It complicates the data more than the modelling. Each marketplace gives you its own fields, at its own level of detail. Matching one SKU across three channels is often the first fortnight of work. It also makes a few things more valuable: listing consistency, cross-channel stock allocation, and knowing which channel a buyer prefers. Budget for that matching work rather than discovering it in week two.
Yes, both have workable APIs and we have done this before. Shopify is the easier of the two. The friction is rarely the storefront. It is everything around it: a separate inventory system, a courier aggregator, a WhatsApp support channel, an accounting package. Those need mapping too, and that is where the effort goes.
Start with an assessment, then decide. 'Messy' covers very different problems. Inconsistent product attributes are a week of work. Stock-outs that look like zero sales are more serious, and they limit what is possible. Wrong stock counts are worse still. No model fixes a physical count problem. We would rather tell you which of the three you are in than take a project that cannot succeed.
Forecasting, basket analysis and fraud scoring are cheap to run. They are small models scoring on a schedule, so the infrastructure cost is modest. Agents built on a large language model carry a cost per action. That cost scales with your volume. A support agent handling two hundred queries a day costs a good deal more than one handling twenty. We work this out against your real volumes before you commit. Insist on that from any vendor.
Yes, including Hinglish and transliterated text, which is what most Indian messages look like. It is strongest in English and Hindi. Quality varies across the other languages. So decide which languages it handles well. Route the rest to a person at once, rather than letting it give a poor answer. Being clear about that line beats finding it out through a bad review.
Guard rails, set by you before it goes near production. A floor price per SKU that is never crossed. A maximum movement per period. An exclusion list for the anchor SKUs buyers judge you by. An optimiser with no limits will find that cutting prices lifts volume. That is true, and it is ruinous. The model recommends within limits. It does not set strategy.
Probably a little. Be wary of a vendor who promises you a percentage. On a large catalogue with repeat buyers, the gain is real. On a few hundred SKUs sold mostly to first-time buyers, expect a small lift in basket size and nothing more. We would suggest forecasting or fraud first. The arithmetic there is far more certain.
COD refusal is often the largest cost you can recover in Indian e-commerce. We treat it as a first-class problem. Refusal prediction lets you ask for prepayment on the risky orders only. Blocking COD outright would cost you more in lost orders than the fraud does. The data you need is already in your courier records: which orders were refused, by whom, to which addresses.
Your data is yours, and you can export it at any time. You get the working system, the documentation and the training. Your team can run it day to day. Anything else is set out in the contract before work starts: model artefacts, source, licence terms. That way there are no surprises on either side.
Fraud and basket analysis, four to six weeks. Forecasting, six to ten weeks. Most of that is working out whether stock-outs can be told apart in your history. Agents, six to twelve weeks, depending on how many systems they touch. Anything promised live in a week has skipped the step where a person checks that your data means what it appears to mean.
Not to start, and probably not for a while. What you need is one person who owns the decisions the models feed. Usually a merchandiser or the founder. Someone who will act on the output. The most common failure is not technical. It is a model producing sound advice that no one has the authority to act on.
Indian retail seasonality is unusual by Western standards. Festival dates move with the lunar calendar. There is regional variation, and there are wedding seasons. A model that assumes a fixed annual pattern handles all of that badly. It is easy to design in at the start. Left out, it produces wrong forecasts every autumn. Ask any vendor how they handle a festival that moves eleven days each year.
We would encourage it. Taking one use case to production shows you where your data and your processes really break. That knowledge makes the second and third much faster. Running three at once gives you three half-finished projects and no idea which one is working.
The assessment phase exists to find that out cheaply. Sometimes the answer is that you do not have enough history. Sometimes the problem is operational, not analytical: stock in the wrong place because of a process, not a poor prediction. We would rather say so in week two than build something that runs and changes nothing.
Recognise your plant in any of that?
Tell us which problem is costing you most and we will tell you honestly whether it is worth building, what data it needs, and roughly what it costs.
Book a Free ConsultationSee our Retail & E-commerce solutions